83% of Our Clients are Likely SNAP Eligible. Here’s How We Did It.
One of the huge opportunities with technology is not just reaching clients who are interested in applying for SNAP, but clients who are likely eligible per FNS requirements. When we reach clients deemed likely eligible, we not only serve them but we increase the capacity of Eligibility Workers to serve those who need them most.
In 2017, we looked at the number of clients in California who were screening likely eligible on Version 2 of mRelief’s platform here. Screening likely eligible meant they met the income and household composition requirements, and 55% of all clients who screened were likely eligible. In fact, when we analyzed the percentage of families who screened likely eligible in Q3 (July-September) 2017 we were at 52%.
As of Q3 2018, 83% of people who use our screening platform meet the basic eligibility requirements. This 60% increase was driven by 2 key factors.
- We have redesigned our approach to gathering information about one of the largest populations of likely ineligible clients in California: SSI Recipients
- We have redesigned our digital marketing infrastructure to optimize not just for screener completions, but likely eligible screener completions
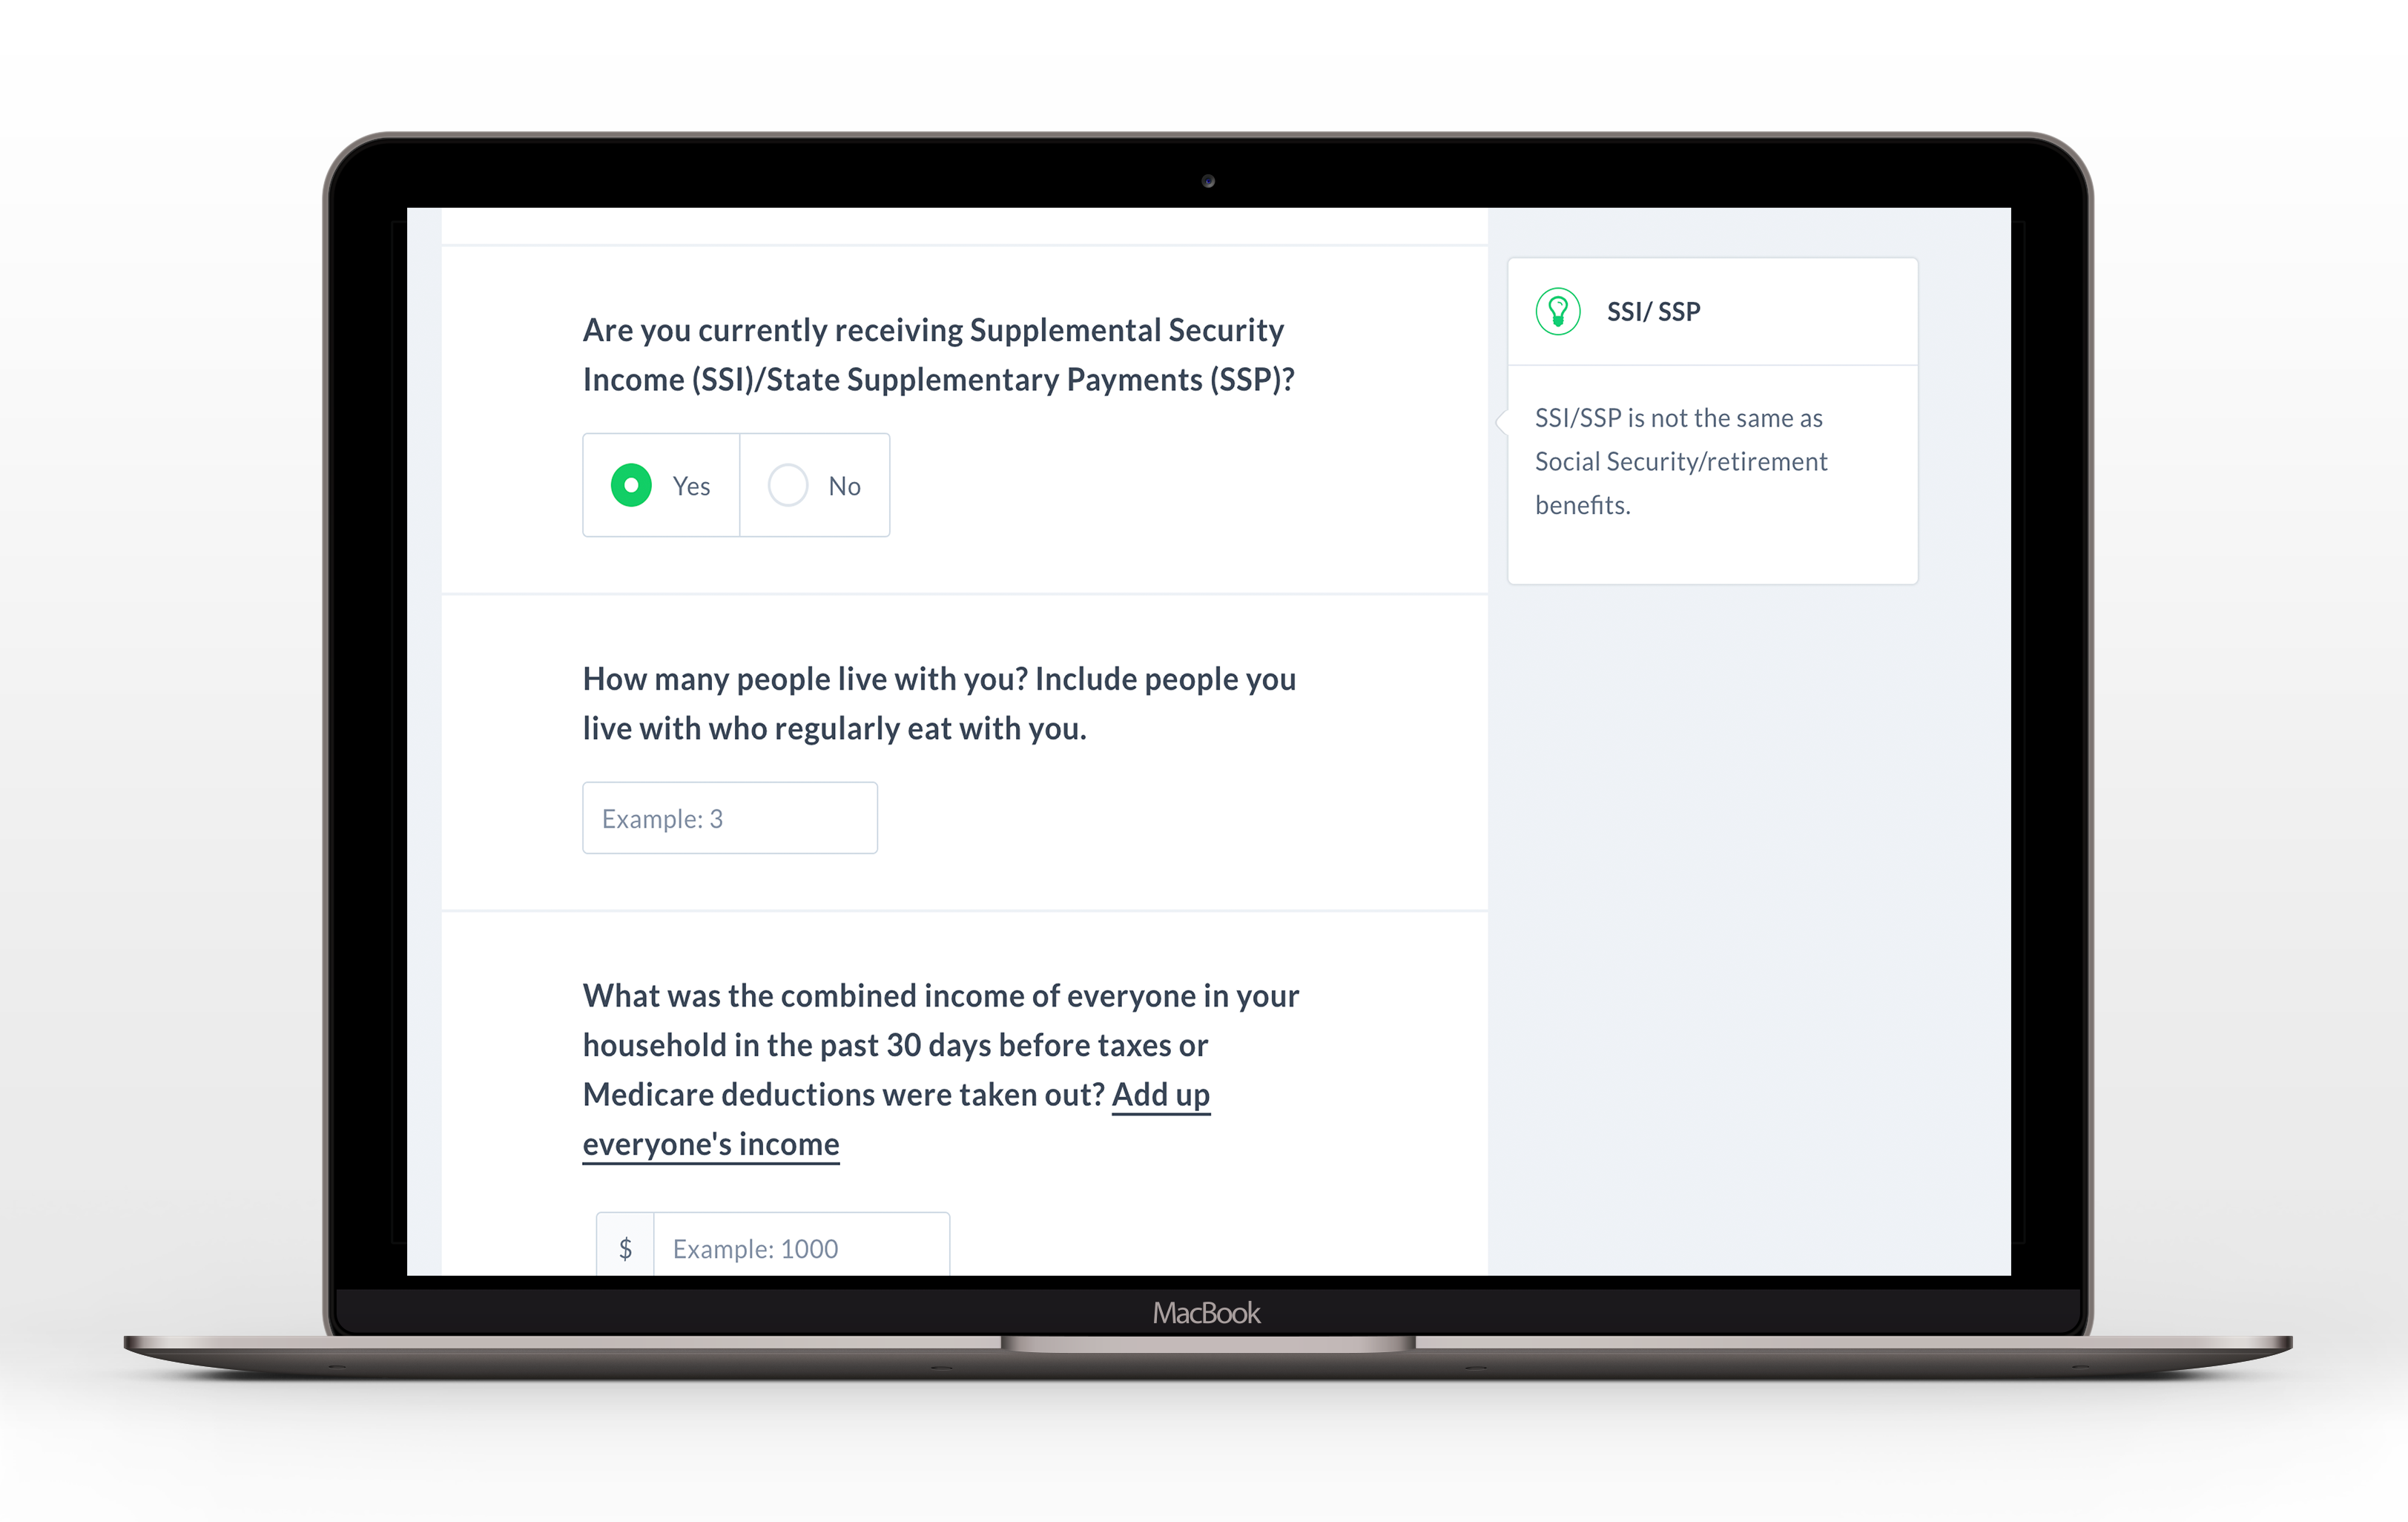
Here is how we asked the SSI question before.
Here is how we ask the SSI question now.
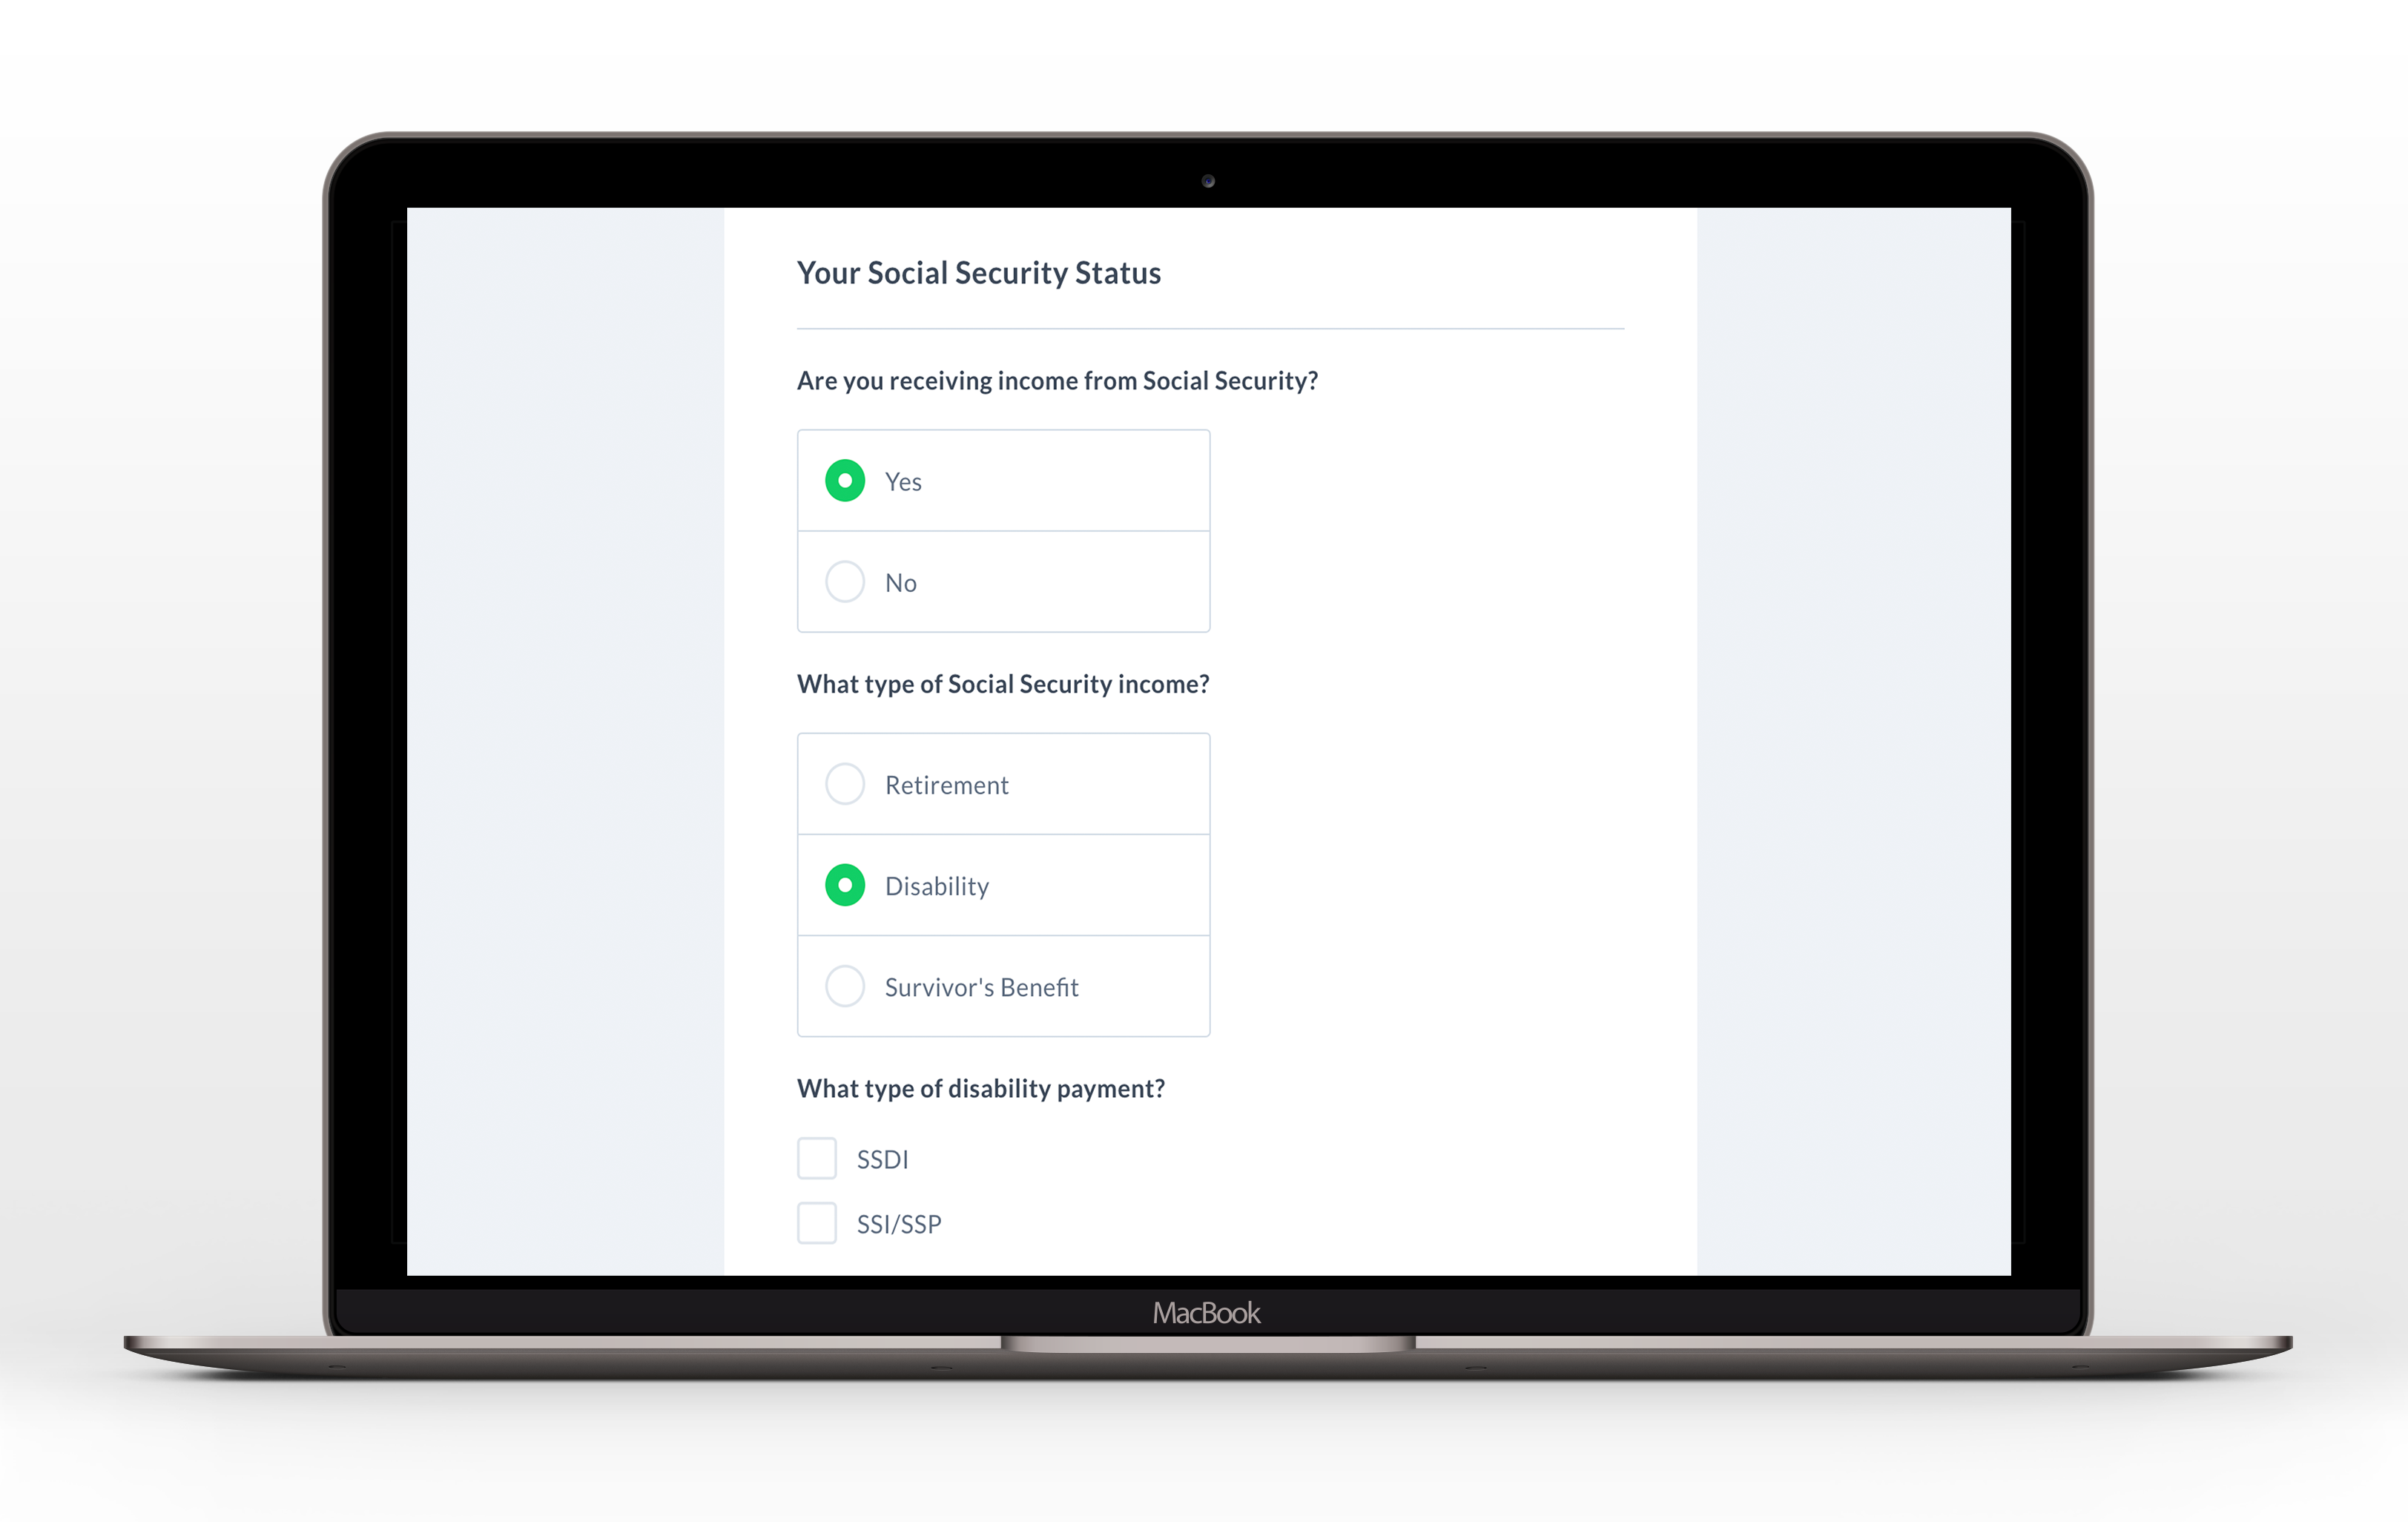
Key changes include:
- Redesigning for clarity by not assuming that clients understood the nuances of income provided by Social Security
- Guiding our users through a step-by-step process to clarify their type of Social Security income
We also made changes to our Facebook Ads to more accurately reach likely eligible clients.
An ad we ran in 2017 was our top-performing ad with the highest screener-completed rate. This ad cost $10.53 per screener completed. During this time, we were not tracking the cost per likely eligible client, but all people who checked their eligibility.
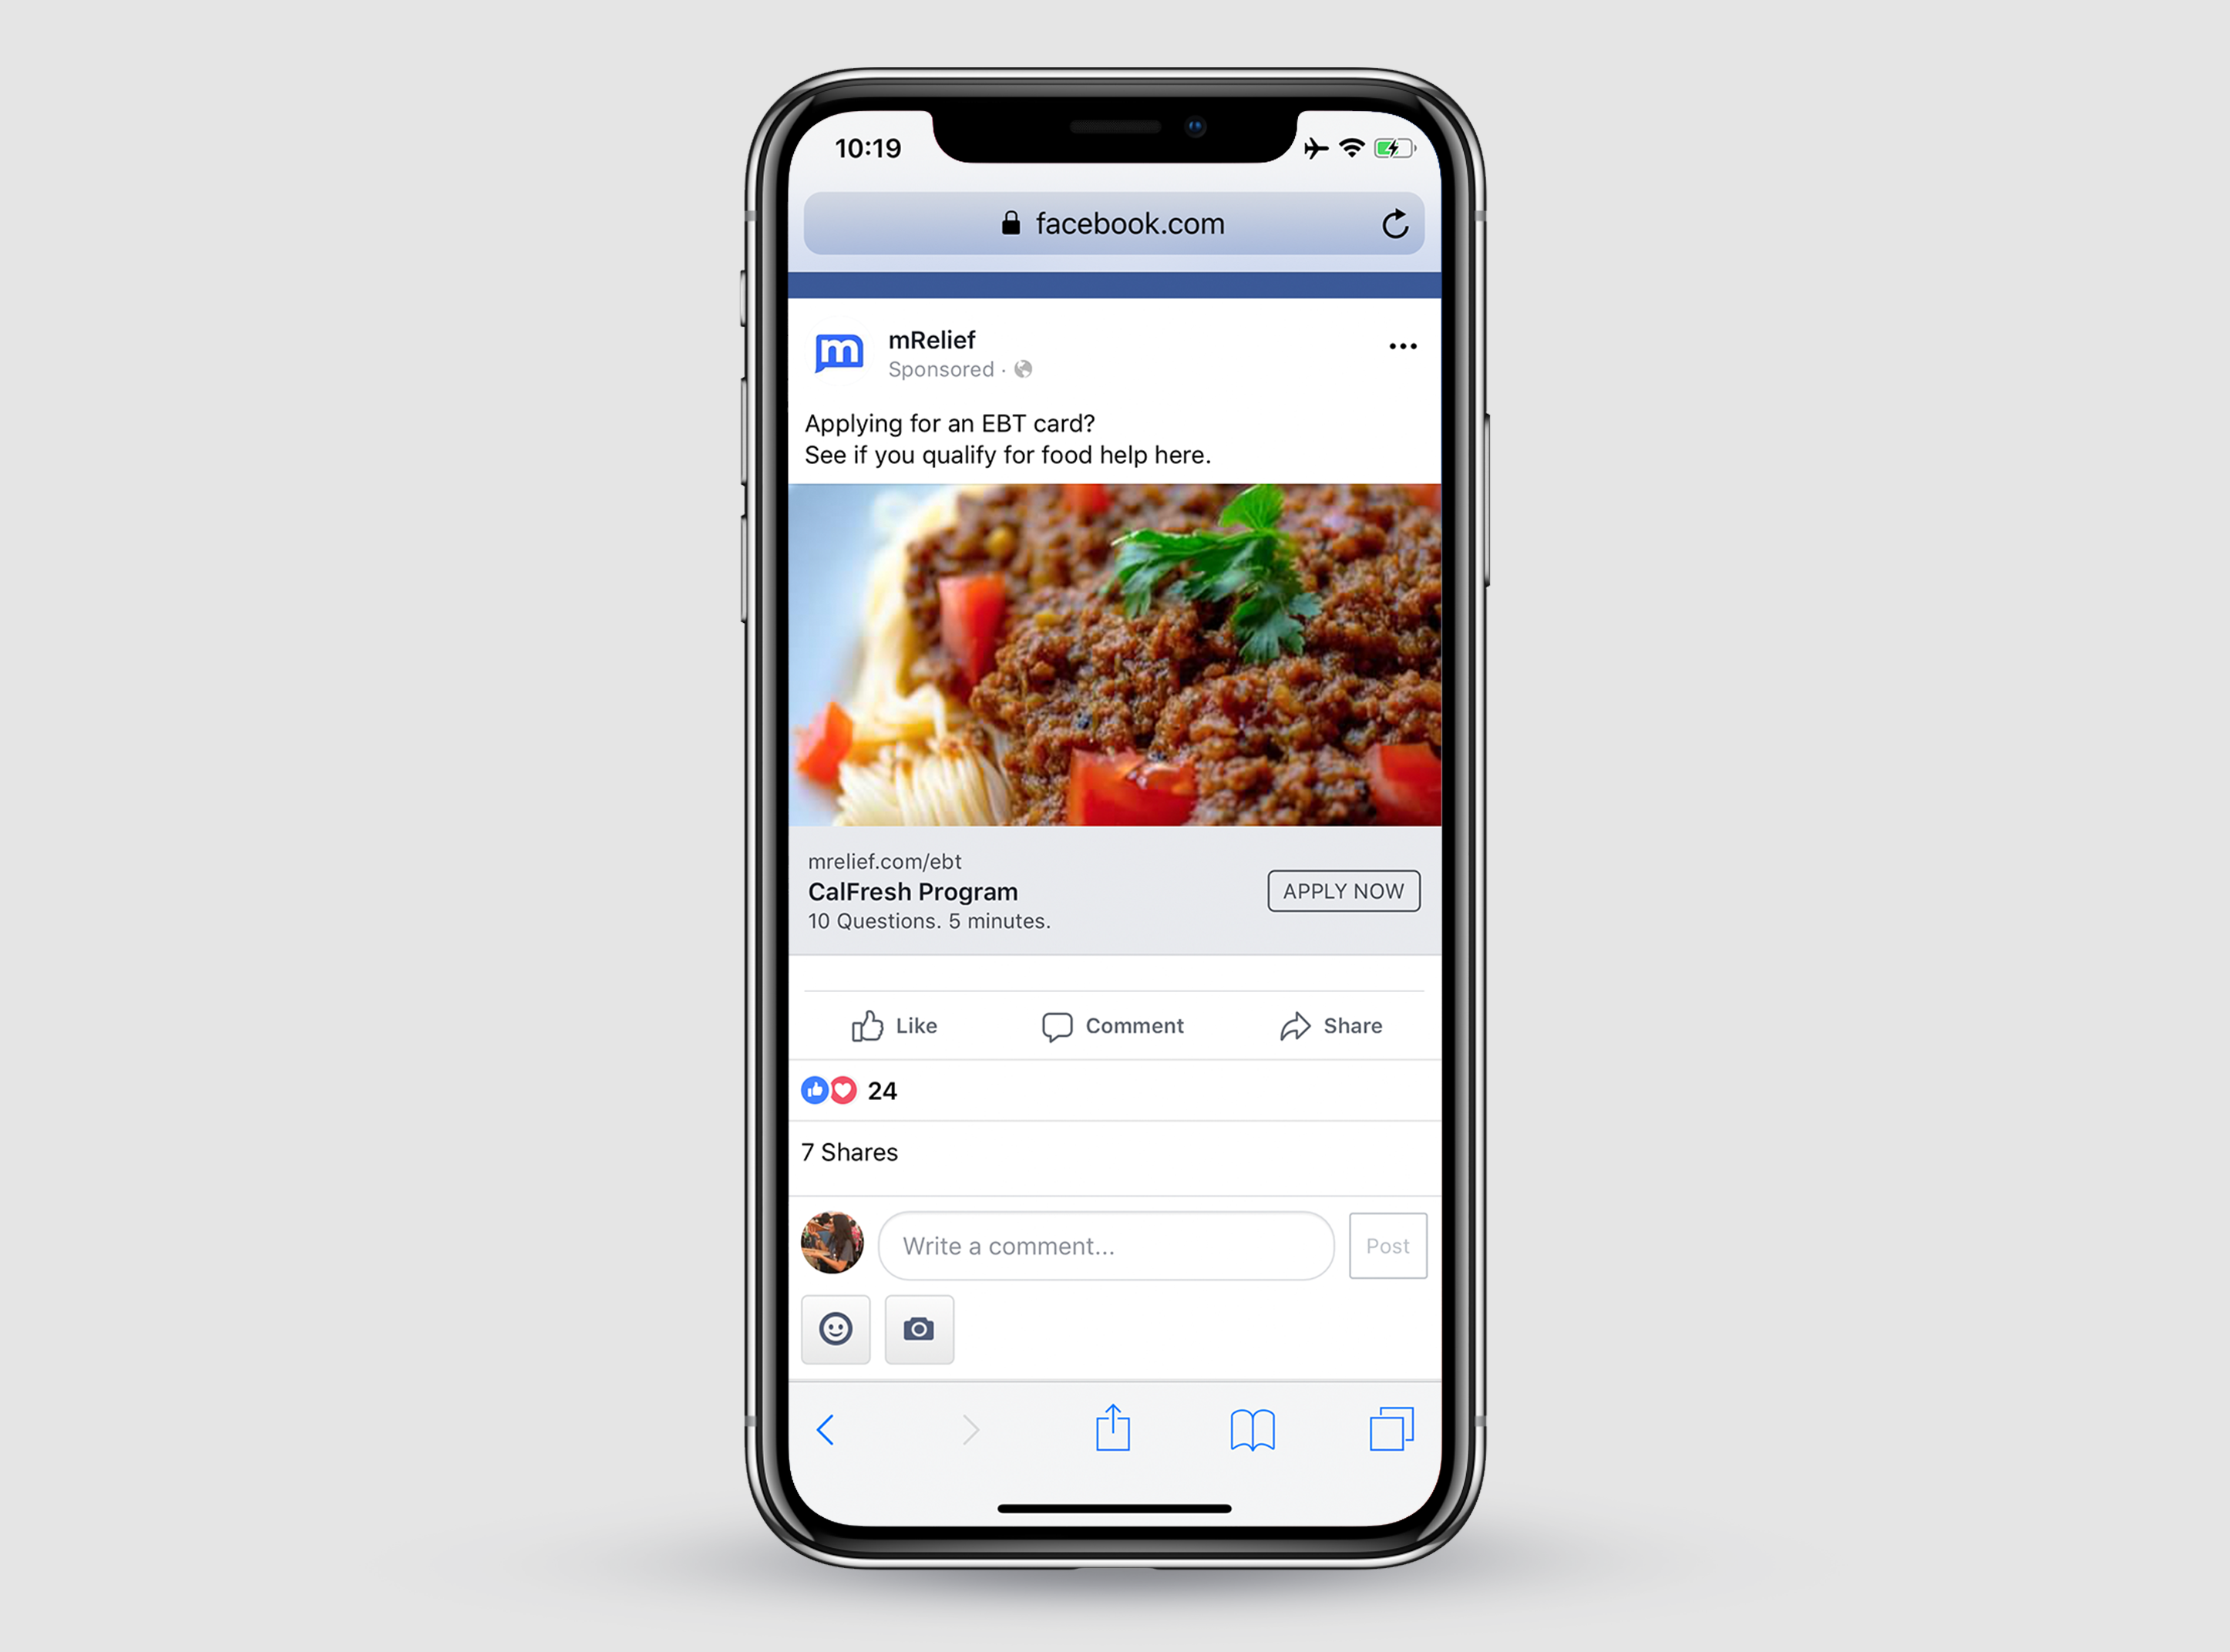
This year, we’ve optimized our Facebook Ads to include a variety of images and copy and to programmatically reach likely eligible clients so that we’re measuring more precisely accurately. This ad cost $1.53 per likely eligible client to screen through our platform.
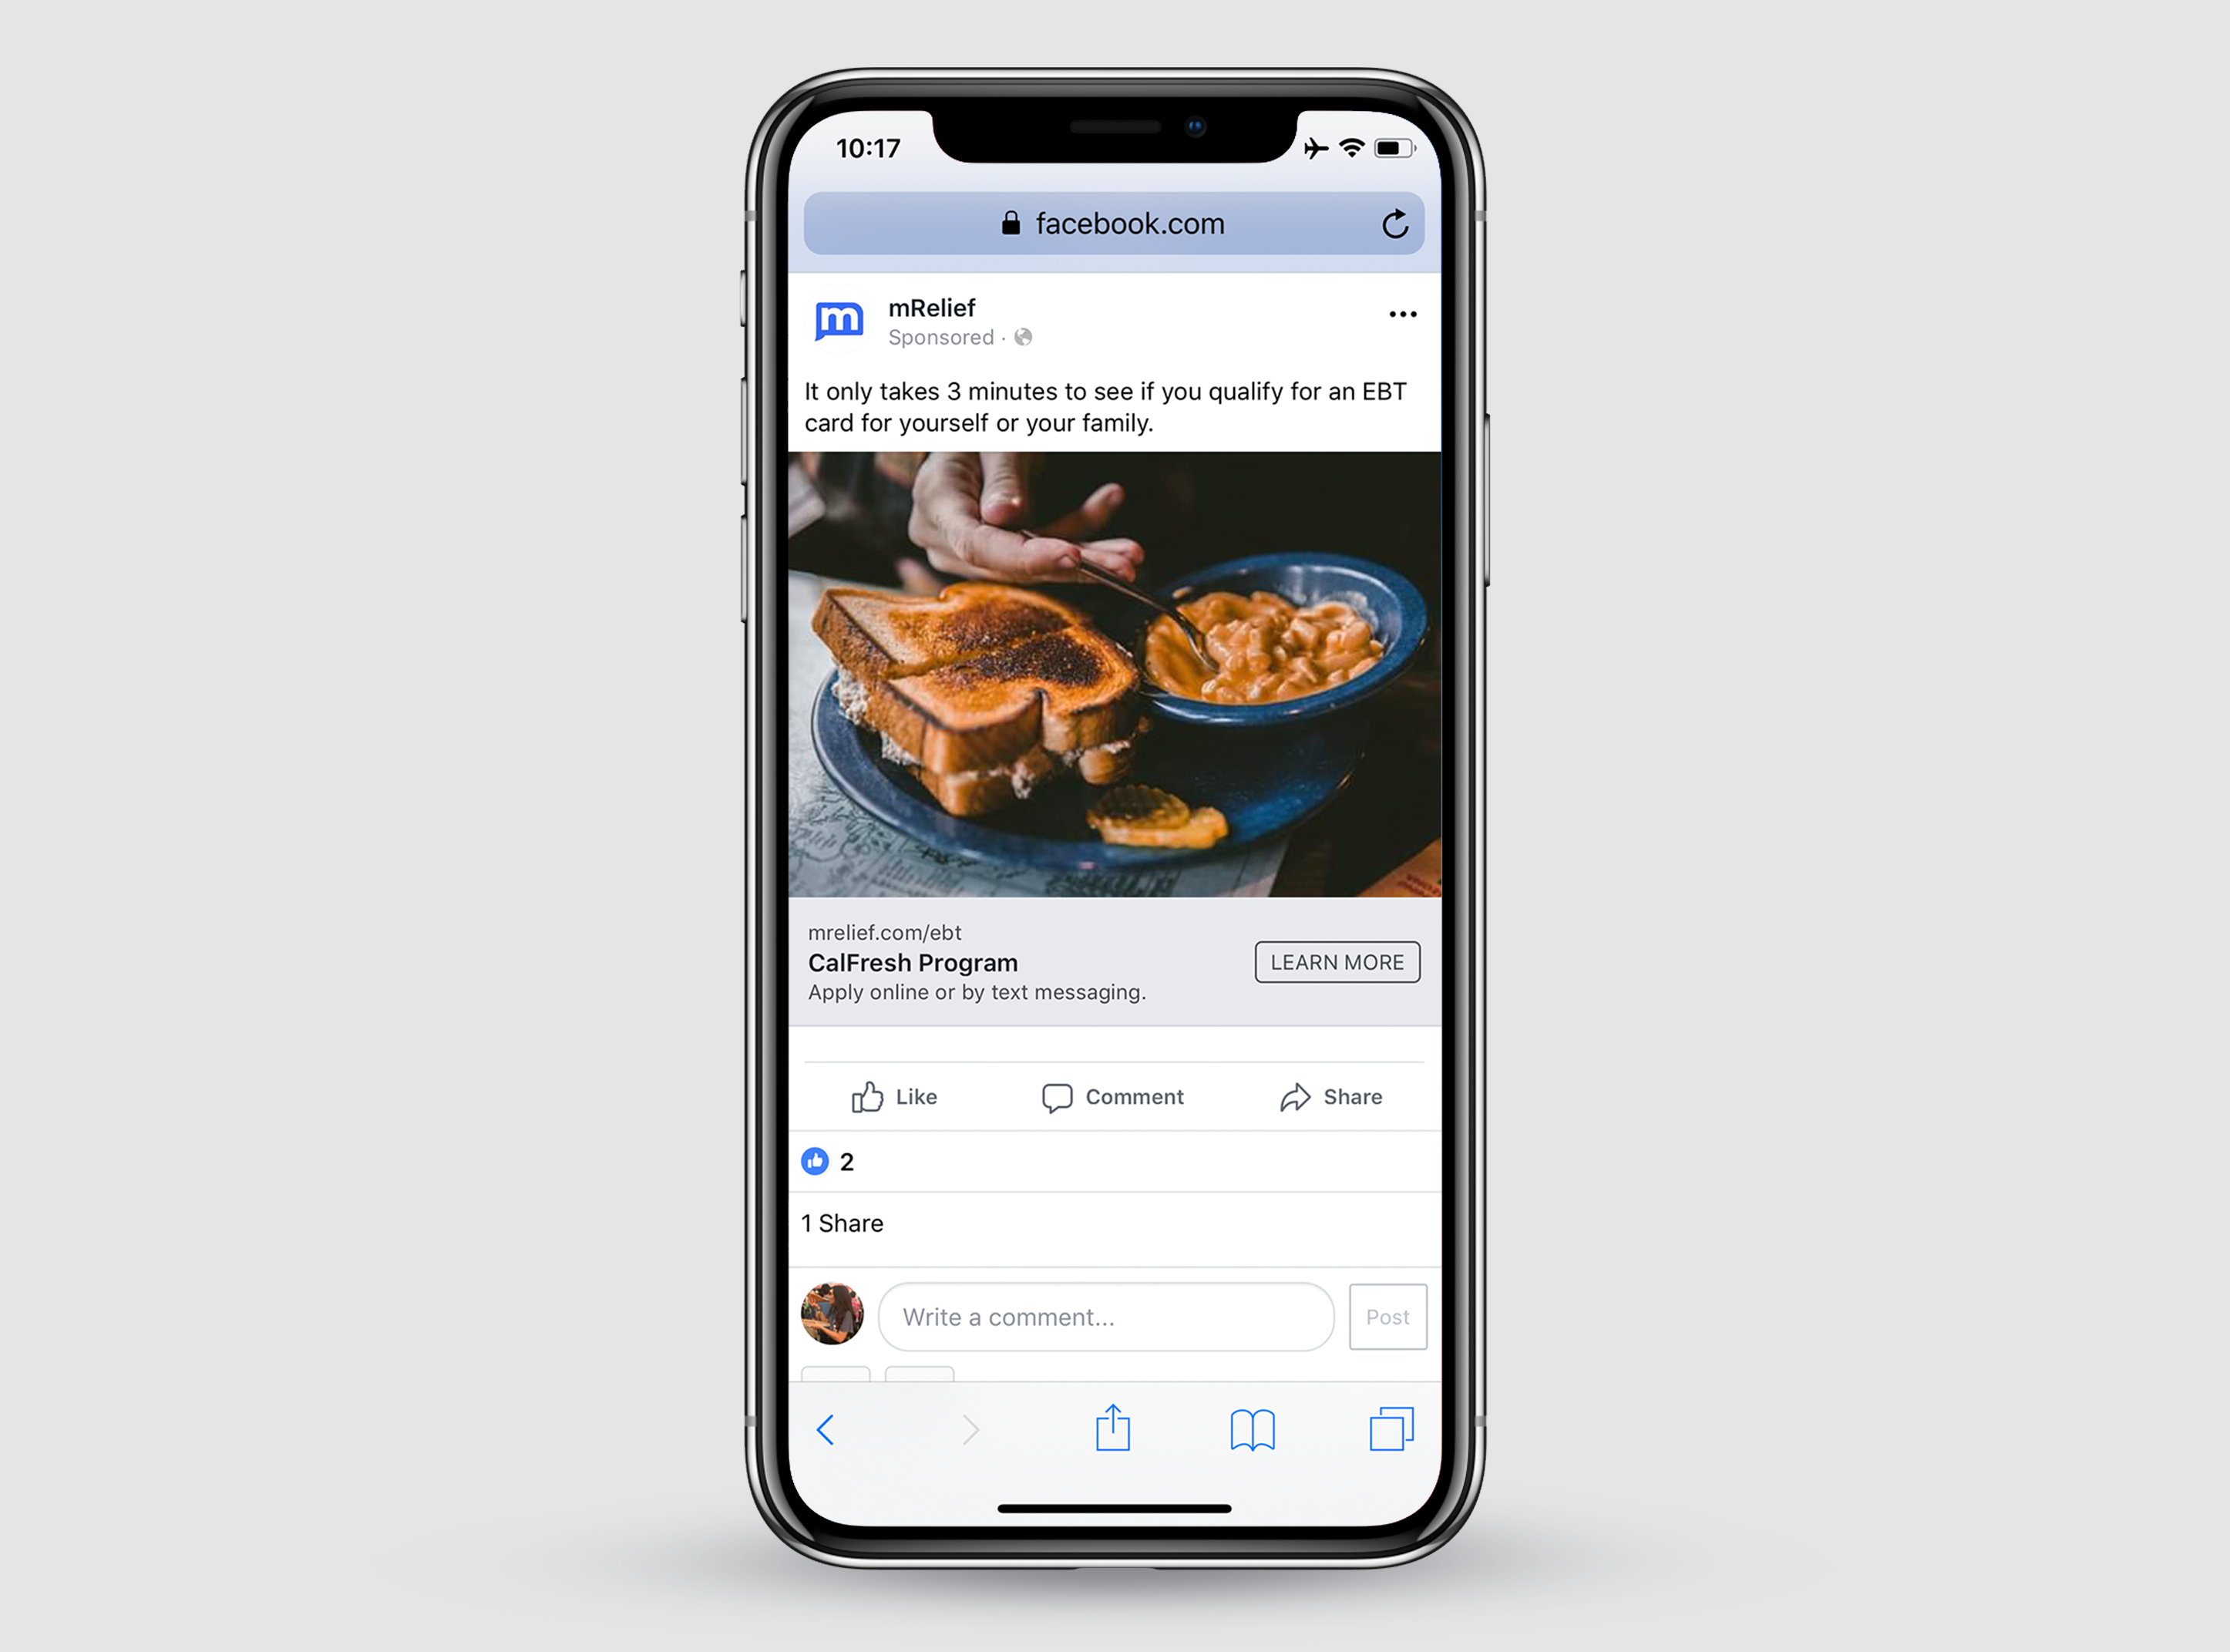
In 2017, our Facebook Ads dashboard shows a high cost per client, called a “lead” on Facebook.

In 2018, our Facebook Ads dashboard shows an 85% decrease in cost, optimized to reach likely eligible clients.

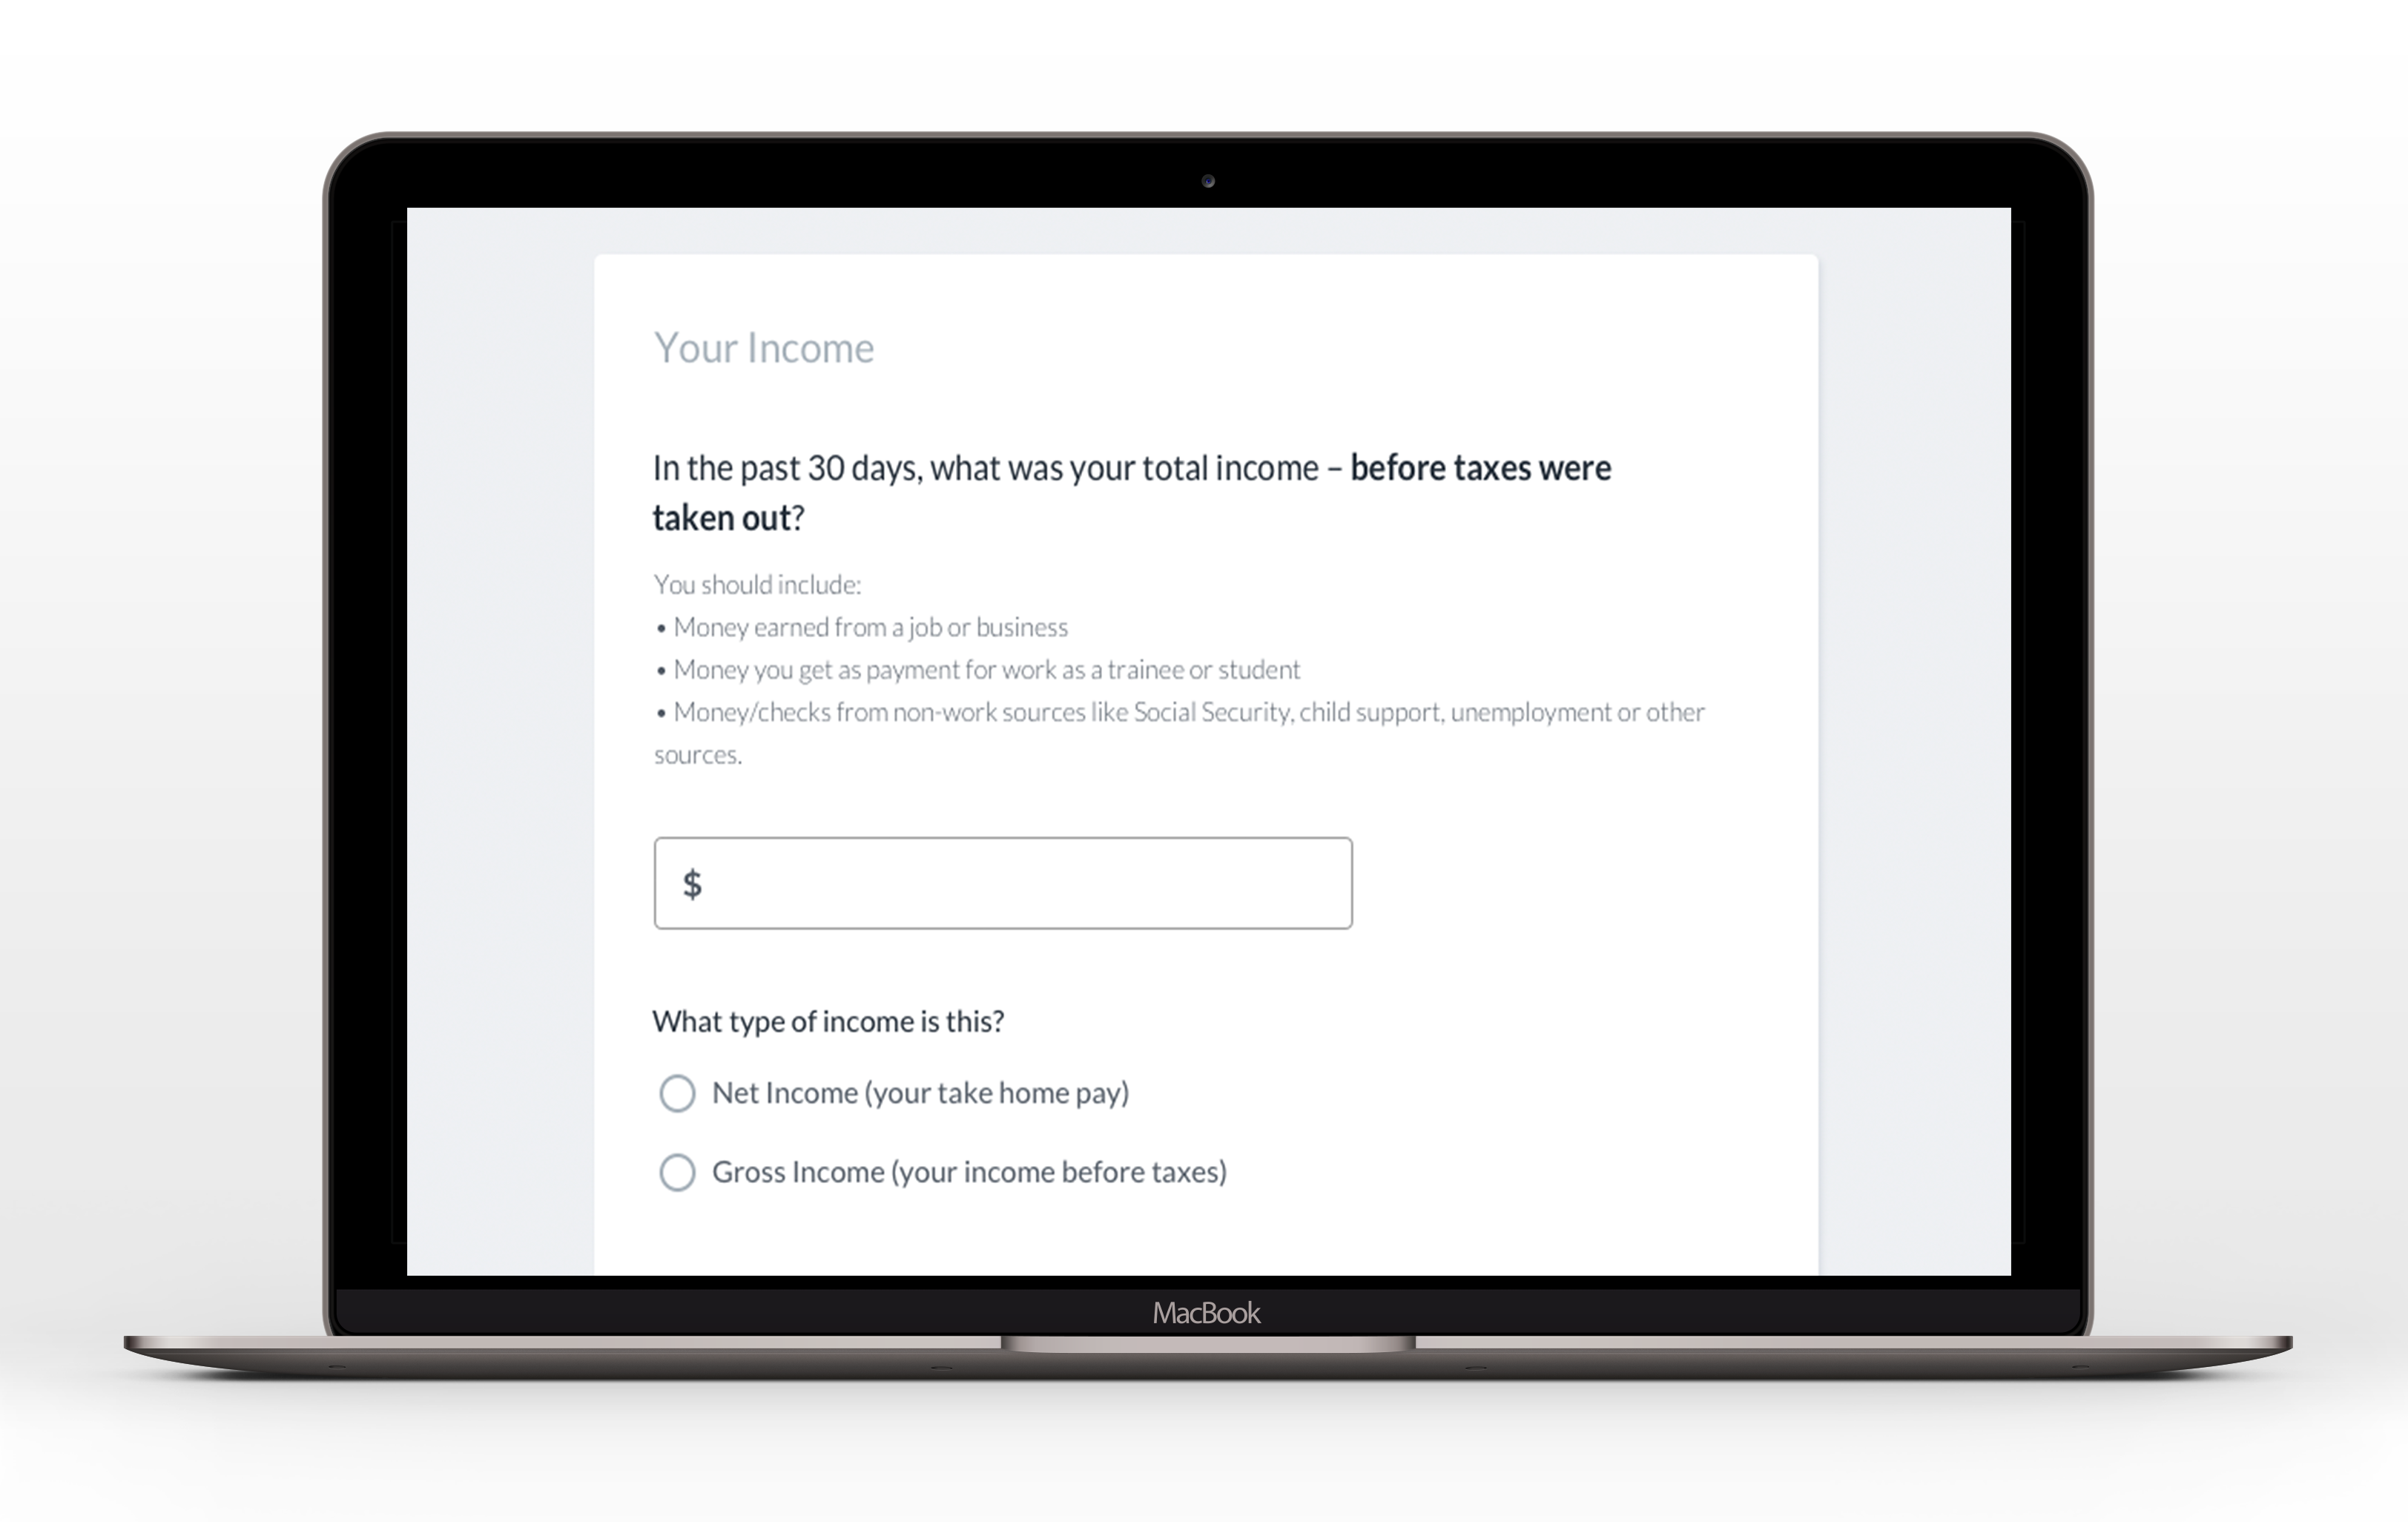
Now that we have made some progress, we are deploying an income experiment to get us closer to 90% likely eligible clients and to better understand how clients identify and define their own income.
We’re looking forward to sharing the results of this test in the December newsletter. See a teaser of what this looks like below.